
The Work Factors tab provides detailed information on each hazard included within the risk assessment.
Individual responses to the questions about severity, frequency, and duration of negative wellbeing impact associated with each hazardare aggregated to calculate the Total Exposure score.
The distribution line shows the percentage of respondents who rated each hazard as low, moderate, high, or very high impact.
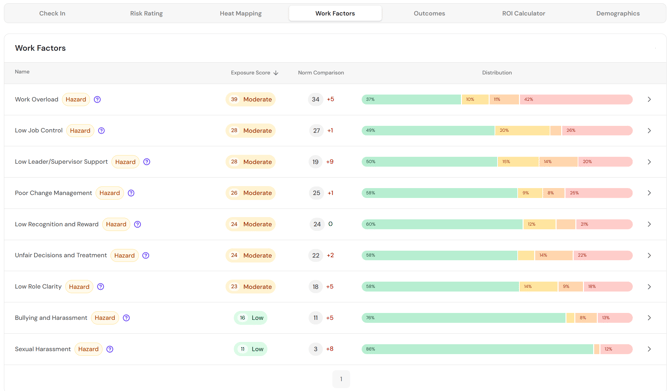
The arrow opens a page with detailed information about responses to each hazard, including the average scores for severity, frequency, and duration.
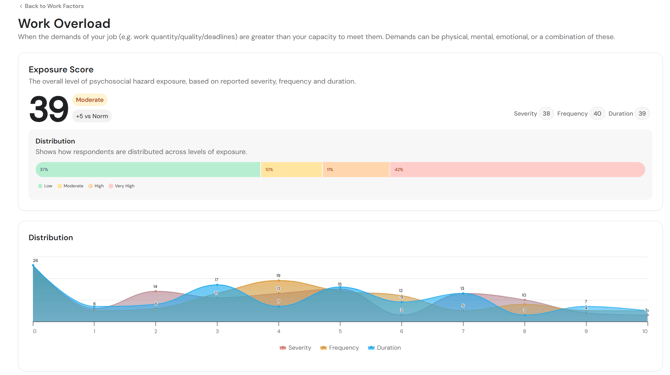
The Distribution shows the response distributions for each hazard or factor, split between positive and negative wellbeing impacts.
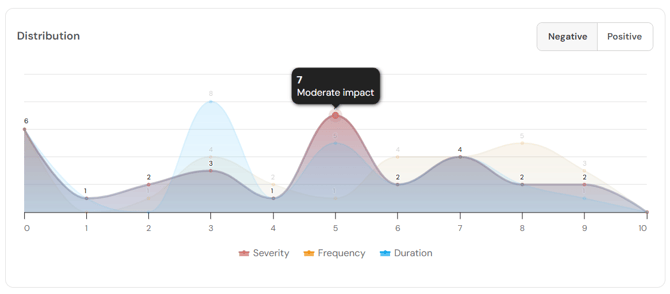
Hover over any data point to see the qualitative anchor it represents.
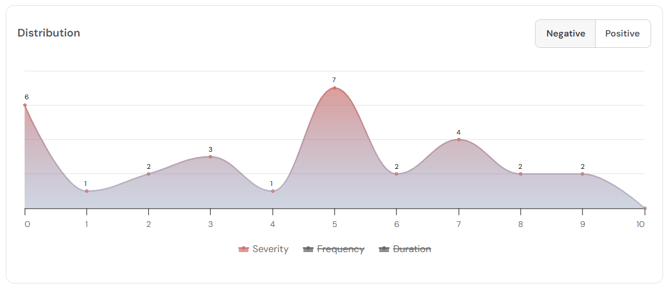
Use the legend beneath the graph to enable or disable graphs for severity, frequency, or duration.
Return to How do I interpret my FlourishDx work factors risk assessment results?
Up Next: How do I interpret my FlourishDx work factors risk assessment Outcomes tab?