Skip to content
  • There are no suggestions because the search field is empty.

How do I interpret my FlourishDx work factors risk assessment Work Factors tab?

The Work Factors tab provides detailed information on each hazard or work factor included within the risk assessment.

If you included both hazards and neutral factors in your assessment, you can choose between viewing based on Exposure Detail or Impact Score. The Exposure Detail view prioritises information about negative wellbeing impacts collected from respondents, while the Impact Score view prioritises information about positive wellbeing impacts.  

The Exposure Detail view defaults to displaying the items in order of total exposure score. You can also sort by the other columns in the table.  

The scores represent the average responses to the questions about severity, frequency, and duration of negative wellbeing impact associated with each item, which are amalgamated to calculate the Total Exposure score.

The Impact Score view defaults to displaying items in order of the impact score, but can also be sorted by the other columns in the table. 

The impact score is calculated from the range of responses across both negative, neutral, and positive wellbeing impacts, and indicates the type (positive/negative) and degree (minor to very high) of wellbeing impact associated with the factor 

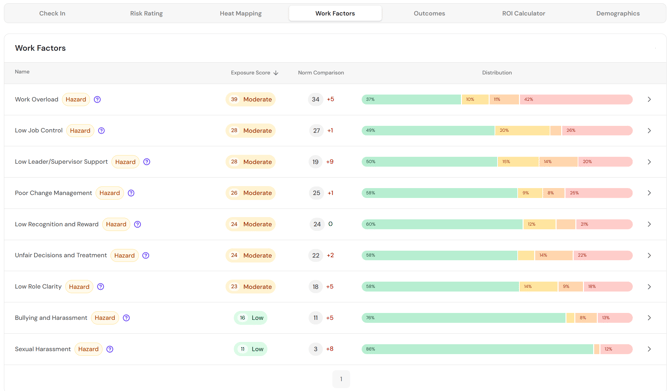
The arrow opens a page with detailed information about responses to each hazard or factor. 

The Group Impact Score shows the spread of responses from positive through to negative wellbeing impact, along with detailed information about the responses within each impact category (Negative, Neutral, and Positive).

The Hazard Exposure box shows the same information as the Exposure Detail page - the average score for severity, frequency, and duration of negative wellbeing impact.

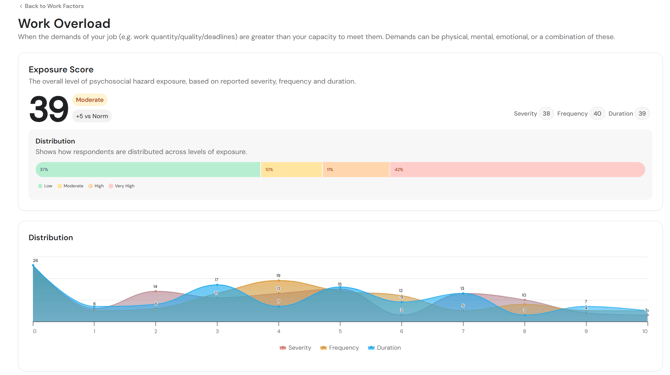
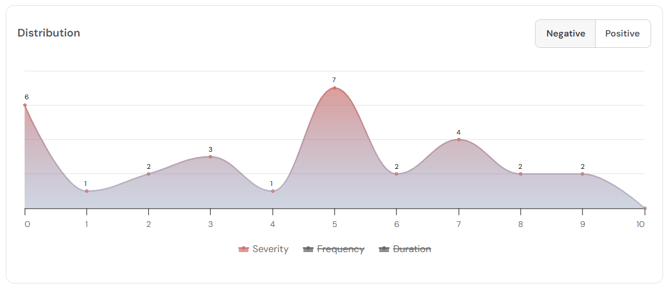
The Distribution shows the response distributions for each hazard or factor, split between positive and negative wellbeing impacts. 

Hover over any data point to see the qualitative anchor it represents.

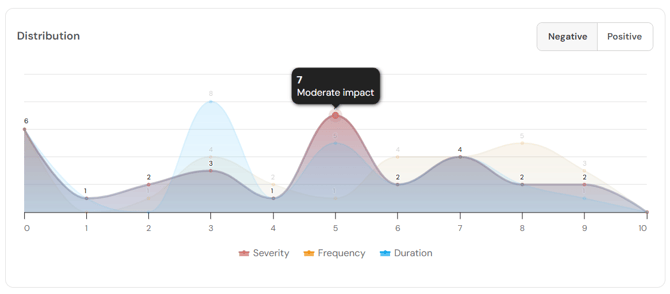
Use the legend beneath the graph to enable or disable graphs for severity, frequency, or duration. 

Toggle between negative and positive impact graphs using the buttons in the top right corner.


Return to How do I interpret my FlourishDx work factors risk assessment results?

Up Next: How do I interpret my FlourishDx work factors risk assessment Outcomes tab?