The Outcomes tab displays the data collected from the outcomes measures included in the risk assessment. Apply the filter in the top dashboard area to filter outcomes by group.
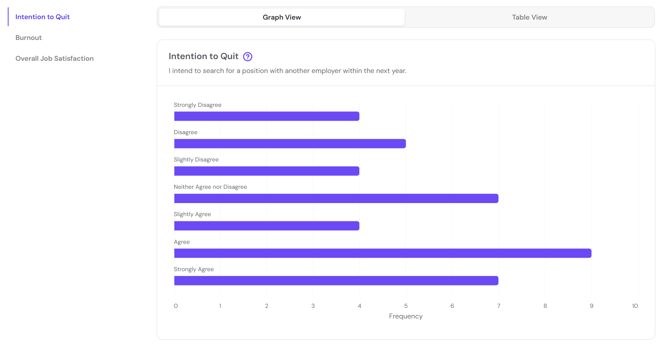
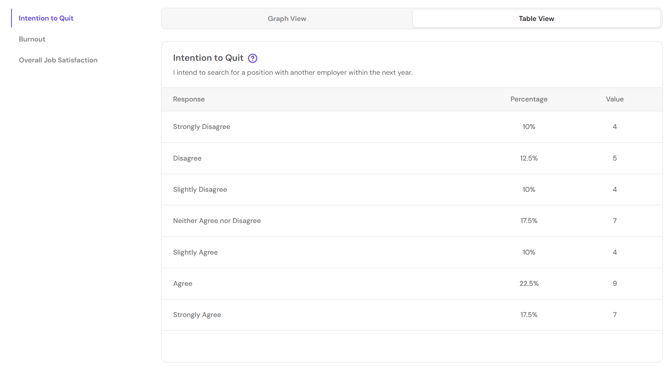
Each outcome measure assessed appears in a sub-menu on the left. Results of each measure are presented in a graph view and a table view, which can be switched between using the tabs above the visualisation.
Each view shows the number of responses received for each response option.
The Table View also shows the percentage of responses accounted for by each response option.
Return to How do I interpret my FlourishDx work factors risk assessment results?
Up Next: How do I use my FlourishDx work factors risk assessment ROI Calculator?