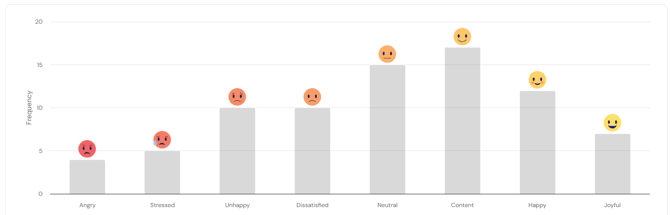
The Wellbeing Check In asks users to answer the question "How are you feeling this week", with options ranging from happy and joyful through to angry and stressed. Users are then asked "Why do you feel this way?" with a range of personal factors and work factors to select. The Check In tab displays the data collected from responses to these questions.
The bar graph shows the number of respondents who selected each mood option.
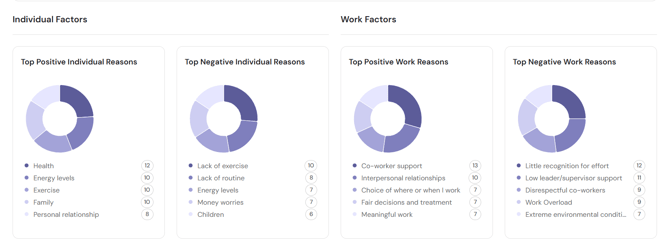
Beneath the bar graph, the donut graphs show the most frequently selected reasons for positive and negative mood, split by individual and work factors.
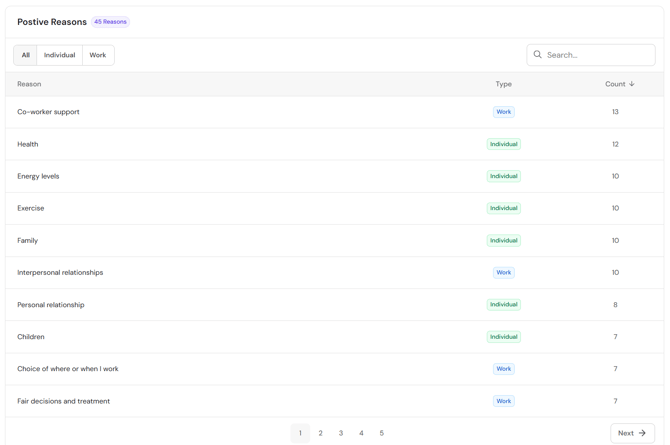
Finally, the table at the bottom of the this section provides the full list of reasons available, along with the count of how many times each reason was selected.
Return to How do I interpret my FlourishDx work factors risk assessment results?
Up next: How do I interpret my FlourishDx work factors risk assessment Risk Rating results?